Published by Adrian Vogel · Reading time: approx. 7 minutes

Almost everyone knows the pattern: you resolve to do something, spend less on subscriptions, pay off the mortgage faster, clear out the basement, and a few weeks later the resolution has fizzled out. It is rarely a lack of willpower. Between "deciding to do something" and "doing it" lies a step that is often skipped: checking and recording your progress regularly.
Control theory of self-regulation describes exactly this step. A goal is only a reference value. The real work is comparing what is with what should be. Without that comparison, a goal remains an intention.
What the Research Says
In 2016 a team led by Benjamin Harkin (University of Sheffield) published a meta-analysis in the Psychological Bulletin that summarises 138 randomised studies with 19,951 participants. The question: do people reach their goals more often when they are prompted to monitor their progress? The answer was yes. The interventions clearly increased the frequency of monitoring (d+ = 1.98; 95 % CI 1.71–2.24) and promoted goal attainment (d+ = 0.40; 95 % CI 0.32–0.48), a small to medium but reliable effect. Because only randomised experiments were included, this is about cause and effect, not merely a correlation. Most of the studies concerned health goals such as weight, smoking, exercise or medication adherence.
The decisive finding for a documentation tool: the effect was stronger when progress was physically recorded (d+ = 0.43 compared with d+ = 0.29 without recording) and when it was reported or made public (d+ = 0.47 and d+ = 0.55 respectively, compared with only d+ = 0.19 when progress remained private and unrecorded). Writing it down beats merely thinking about it. Presumably because what is written down is harder to gloss over, especially when the news is uncomfortable.
Why it works: what is documented stays in view, and only the comparison of actual and target produces information you can act on. According to the goal-setting theory of Locke and Latham (2002), specific goals only improve performance when feedback is available.
Related findings from other fields, as analogies only: in the Kaiser Permanente study by Hollis et al. (2008), those who kept records on six or more days per week lost around 8.2 kg compared with about 3.7 kg for those who rarely kept records. Teresa Amabile and Steven Kramer found in almost 12,000 diary entries that visible progress in meaningful work is the strongest driver of a positive inner work life ("small wins"). And Nunes and Drèze (2006) showed with loyalty cards that people who can already see a head start are more likely to complete the task (34 % vs. 19 % redemption with identical real effort).
For money, none of this is automatic. The German consumer advice centre (Verbraucherzentrale) describes the benefit of a household ledger soberly: you can trace where the money goes and take countermeasures more effectively. But it does not necessarily lead to more money. A field experiment by Irrational Labs with a fintech app (9,035 people, 13 weeks) found that budgeting increased engagement but showed no statistically significant reduction in spending compared with the control group. And Thaler's mental accounting explains why category-based budgets work at all: people assign expenses to mental accounts, and a budget per category serves as self-control.
The Month as a Feedback Loop: the Household Ledger
A simple design principle follows from the research: feedback must be regular, concrete and tied to a reference value.
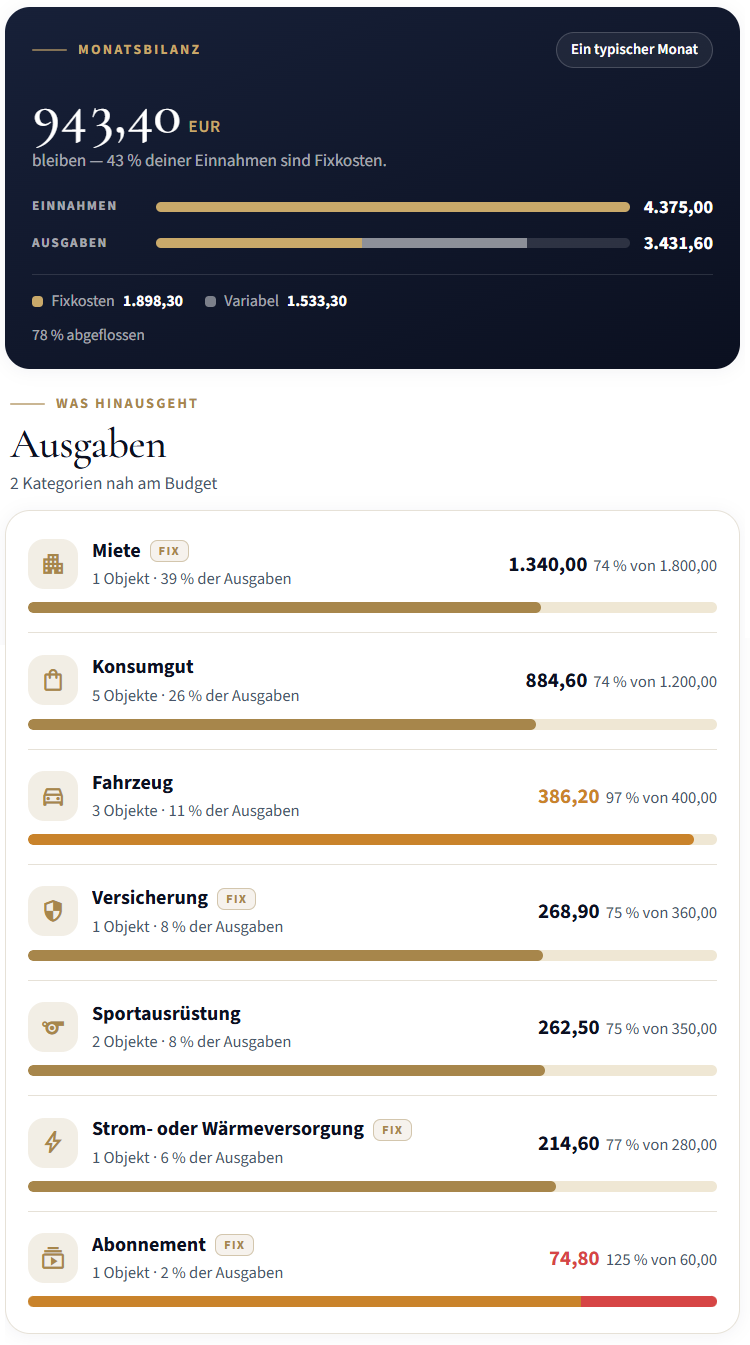
The month is the natural unit of most cash flows: salary, rent, subscriptions, insurance. A monthly balance with income, expenses and what is left is exactly the comparison that control theory describes. A budget per category with a visible fill level shows where things are getting tight before they are. That is Thaler's mental accounting, only written down. The fixed-cost ratio tells you how much of your income is already committed before the month even begins.
What makes the OWNAMIC Household Ledger different: the categories are tied to documented things, not to abstract account transactions. The loan instalment belongs to a specific property, the insurance premium to specific items, the subscription to a specific device. A number becomes a reference to something you own and can therefore also question.
Example (fictional): For years Lena has been paying "something around 100 euros" for streaming, cloud storage and apps. When she sets up subscriptions as their own category with a monthly budget and records each service as an object, she sees the fill level for the first time: in March the category is already above 90 % by the middle of the month. Clicking through, she discovers a music service she has not used since moving house and a duplicate cloud storage plan. She cancels both. In April the fill level is noticeably lower – not because the app recommended anything, but because she saw the gap.
Keeping a Distant Goal in View: the Big Picture
Monthly feedback keeps everyday life on course. But many goals lie years away: paying off a property, building wealth, working less at 60.
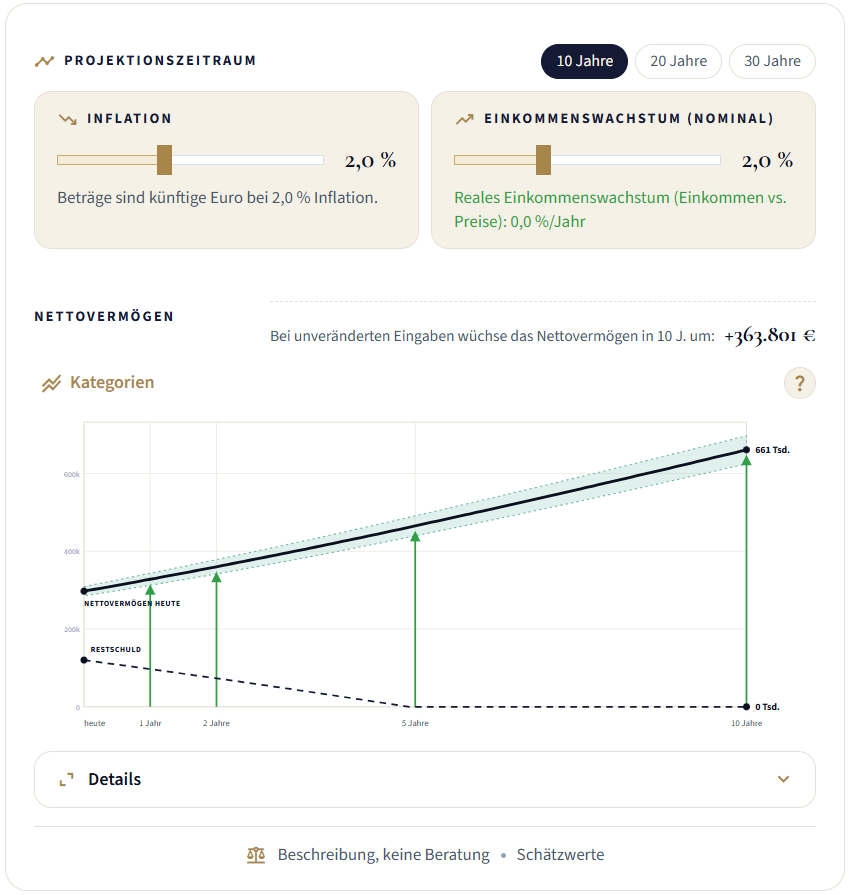
According to Locke and Latham, a goal only works if it is specific and feedback on it exists. A curve without a target mark shows where things are heading, but not whether that is enough. So the Big Picture lets you enter a wealth goal, drawn into the chart as a dashed line. Where the curve crosses it sits a small star. The gap between target and reality stops being an arithmetic exercise and becomes a distance you can see. The goal does not enter the calculation; it is the yardstick, not the engine.
Amabile's "small wins" arise when you can see the curve moving in the right direction. Remaining debt falling and net worth growing, plotted over a horizon of 10, 20 or 30 years, turn an abstract distant goal into recognisable stages, and the annual surplus shows whether the engine is running.
Anyone pursuing a goal over twenty years is dealing with unknowns: inflation, income, changes in the value of property or collections. The Big Picture does not hide them behind a single number. It shows a corridor ("from–to, no promise"), makes every assumption visible as a slider, and starts with the most modest one: no appreciation in value unless you enter something different yourself. On the wealth goal it therefore names a span of years for how long it could take, not a date. If the goal is not reached within the chosen horizon, that is what it says. That is not caution for its own sake but the prerequisite for being able to trust the progress you see.
And one more thing: everything that is not recorded enters the carry-forward as zero and makes the curve too optimistic. The tool points this out instead of hiding it. Those who record everything see reality. Those who leave gaps see a friendlier version of it.
Example (fictional): Markus and Sina bought a house three years ago and want to know whether they will have brought the remaining debt down significantly by the end of the fixed-interest period. In the Big Picture they see the dashed remaining-debt line falling – but also a warning: their variable costs are barely recorded, the curve is too optimistic. For two months they enter groceries, fuel and small purchases after the fact. The curve flattens, and the corridor at the end of the horizon moves down a little. That is sobering at first – but it is the first version of the curve they believe. From then on they look at the remaining debt once a quarter and take pleasure in every step that has actually happened.
Making Letting Go Measurable: the Letting-Go Balance
Letting go is hard, and there is a name for that. The endowment effect (Kahneman, Knetsch & Thaler, 1990) states that as soon as we own something, we value it more highly than we would be willing to pay to acquire it. In the well-known mug experiment, owners demanded around two and a half times what non-owners were willing to pay, purely because of ownership. That is why things nobody needs any more pile up: selling feels like a loss.
What helps against this effect is what helps against any deviation from a goal: name the goal, count progress, write progress down. The Letting-Go Balance treats letting go as a goal with two measures. The first is the proceeds, a figure that grows with every sale and sets a real counter-value against the perceived loss. The second is the count: how many objects in a collection have already been let go, relative to the whole. That is the visible head start from the Endowed Progress Effect. Given away and donated count just as much as sold, because progress is measured by letting go, not by money. And every object keeps its history: when it arrived, what it cost, where it went. Research suggests that fewer household possessions may be linked to greater well-being (Saxbe & Repetti, 2010, found less favourable cortisol patterns in people who described their homes as cluttered). That is a correlational finding, not proof of causation.
Example (fictional): Thomas has collected coins for more than twenty years and knows he should part with about a third of them – duplicates, mistaken purchases, pieces that no longer mean anything to him. For years he has put it off; every piece feels more valuable in his hand than it did when he bought it. Then he sets himself a goal: twenty objects this year. After the first sale, the Letting-Go Balance of his collection shows "1 of 60" and the proceeds. After the third month it reads "9 of 60", including two coins he gave to his nephew. The counter grows, the proceeds grow, and the shelf empties. What carries him is not the money – it is the status he can see at any time.
Where Monitoring Does Not Help
Monitoring is a tool, not magic. People avoid unpleasant financial information; Karlsson, Loewenstein and Seppi (2009) coined the term ostrich effect for it, and Sicherman et al. (2016) showed with real login data that account logins fell by 9.5 % after market declines. Those who expect bad news look less often, precisely when looking would be most useful. A tool cannot dissolve that avoidance, only lower the hurdle. If a tracker persistently shows that you are missing your goal, that can be discouraging. Sometimes letting go of an unattainable goal is then the sensible thing, but that is a decision the tool does not make for you. And seeing alone does not reliably reduce spending, as the Irrational Labs experiment shows.
OWNAMIC describes, it does not advise. The figures in the Big Picture are corridors with visible assumptions you set yourself – not forecasts and not investment recommendations. What follows from them is your own decision, where appropriate with professional advice.
So the evidence is robust and modest at the same time: documenting progress increases the probability of reaching a goal, and the effect is larger when you write the progress down rather than just thinking about it. None of the three features produces a result on its own. They make progress visible. The rest is up to you.
OWNAMIC is a platform for the private documentation of possessions, receipts, maintenance histories and proof of origin. The Household Ledger, the Big Picture and the Letting-Go Balance describe your own situation – they do not advise, make no forecasts and do not replace professional advice.
Evidence Table
| Claim | Status | Source |
|---|---|---|
| Monitoring progress increases goal attainment (d+ = 0.40; CI 0.32–0.48) | evidenced | Harkin et al. 2016 |
| 138 studies, 19,951 participants; monitoring frequency d+ = 1.98 | evidenced | Harkin et al. 2016 |
| Recording works better (0.43 vs. 0.29; objective 0.57 vs. 0.23) | evidenced | Harkin et al. 2016 |
| Public/reported works better (0.55 / 0.47 vs. 0.19) | evidenced | Harkin et al. 2016 |
| Specific goals + feedback improve performance | evidenced | Locke & Latham 2002 |
| Food diary roughly doubles weight loss (8.2 vs. 3.7 kg) | evidenced (analogy) | Hollis et al. 2008 |
| Visible progress ("small wins") drives motivation | evidenced | Amabile & Kramer 2011 |
| Artificial head start increases completion rate (34 % vs. 19 %) | evidenced | Nunes & Drèze 2006 |
| Endowment effect: owners demand ~2.5 times the price | evidenced | Kahneman et al. 1990 |
| Mental accounting: category-based budgets as self-control | evidenced | Thaler 1985/1999 |
| Ostrich effect: logins fall 9.5 % after market declines | evidenced | Sicherman et al. 2016 |
| Clutter correlates with cortisol/mood (not causal) | researched (correlational) | Saxbe & Repetti 2010 |
| Budgeting does not automatically reduce spending | evidenced | Irrational Labs |
| A household ledger does not necessarily lead to more money | evidenced | Verbraucherzentrale |
| Examples Lena / Markus & Sina / Thomas | assumed (fictional, illustrative) | – |
Sources
- Harkin, B., Webb, T. L., Chang, B. P. I., Prestwich, A., Conner, M., Kellar, I., Benn, Y., & Sheeran, P. (2016). Does monitoring goal progress promote goal attainment? A meta-analysis of the experimental evidence. Psychological Bulletin, 142(2), 198–229. https://doi.org/10.1037/bul0000025 (Open Access: https://eprints.whiterose.ac.uk/id/eprint/87431/)
- Locke, E. A., & Latham, G. P. (2002). Building a practically useful theory of goal setting and task motivation. American Psychologist, 57(9), 705–717.
- Hollis, J. F., Gullion, C. M., Stevens, V. J., et al. (2008). Weight loss during the intensive intervention phase of the Weight Loss Maintenance Trial. American Journal of Preventive Medicine, 35(2), 118–126.
- Amabile, T. M., & Kramer, S. J. (2011). The Progress Principle: Using Small Wins to Ignite Joy, Engagement, and Creativity at Work. Harvard Business Review Press.
- Nunes, J. C., & Drèze, X. (2006). The Endowed Progress Effect: How Artificial Advancement Increases Effort. Journal of Consumer Research, 32(4), 504–512.
- Kahneman, D., Knetsch, J. L., & Thaler, R. H. (1990). Experimental Tests of the Endowment Effect and the Coase Theorem. Journal of Political Economy, 98(6), 1325–1348.
- Thaler, R. H. (1985). Mental Accounting and Consumer Choice. Marketing Science, 4(3), 199–214; Thaler, R. H. (1999). Mental Accounting Matters. Journal of Behavioral Decision Making, 12(3), 183–206.
- Karlsson, N., Loewenstein, G., & Seppi, D. (2009). The ostrich effect: Selective attention to information. Journal of Risk and Uncertainty, 38, 95–115.
- Sicherman, N., Loewenstein, G., Seppi, D. J., & Utkus, S. P. (2016). Financial Attention. The Review of Financial Studies, 29(4), 863–897.
- Saxbe, D. E., & Repetti, R. (2010). No Place Like Home: Home Tours Correlate With Daily Patterns of Mood and Cortisol. Personality and Social Psychology Bulletin, 36(1), 71–81.
- Verbraucherzentrale (German consumer advice centre): "Haushaltsbuch führen: Überblick über Ihre Finanzen." (verbraucherzentrale.de)
- Irrational Labs: "Does Budgeting Help You Save Money?" (field experiment, 9,035 participants, 13 weeks).